Introduction
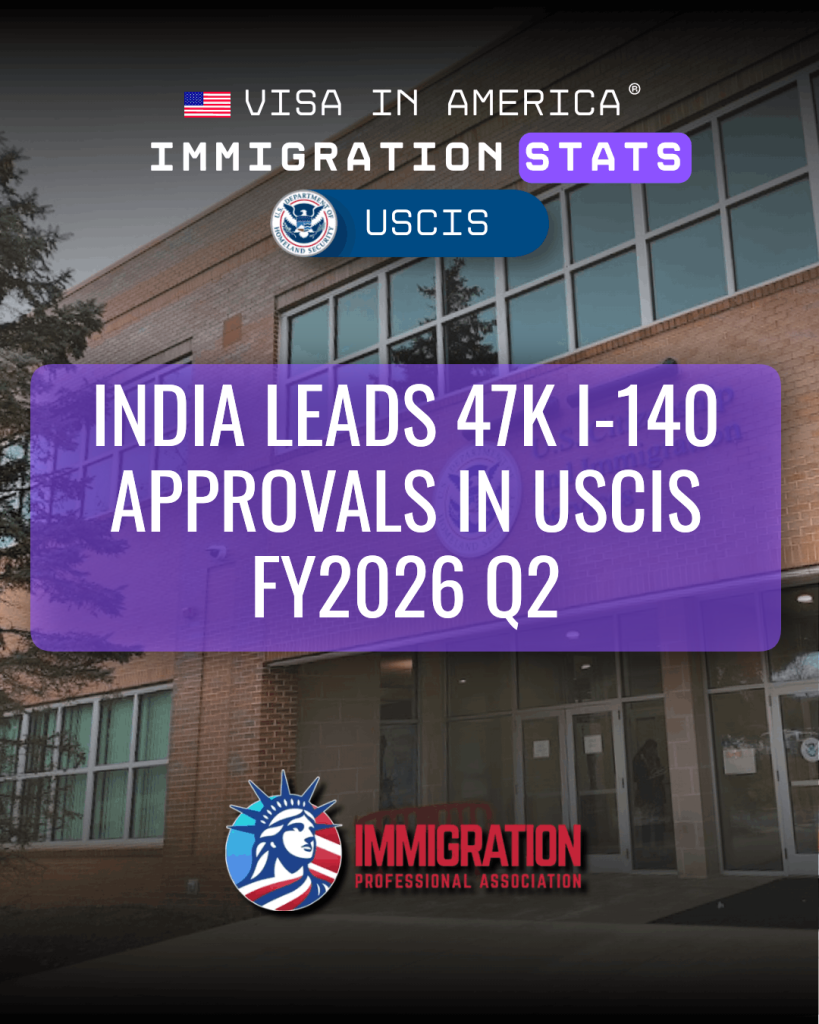
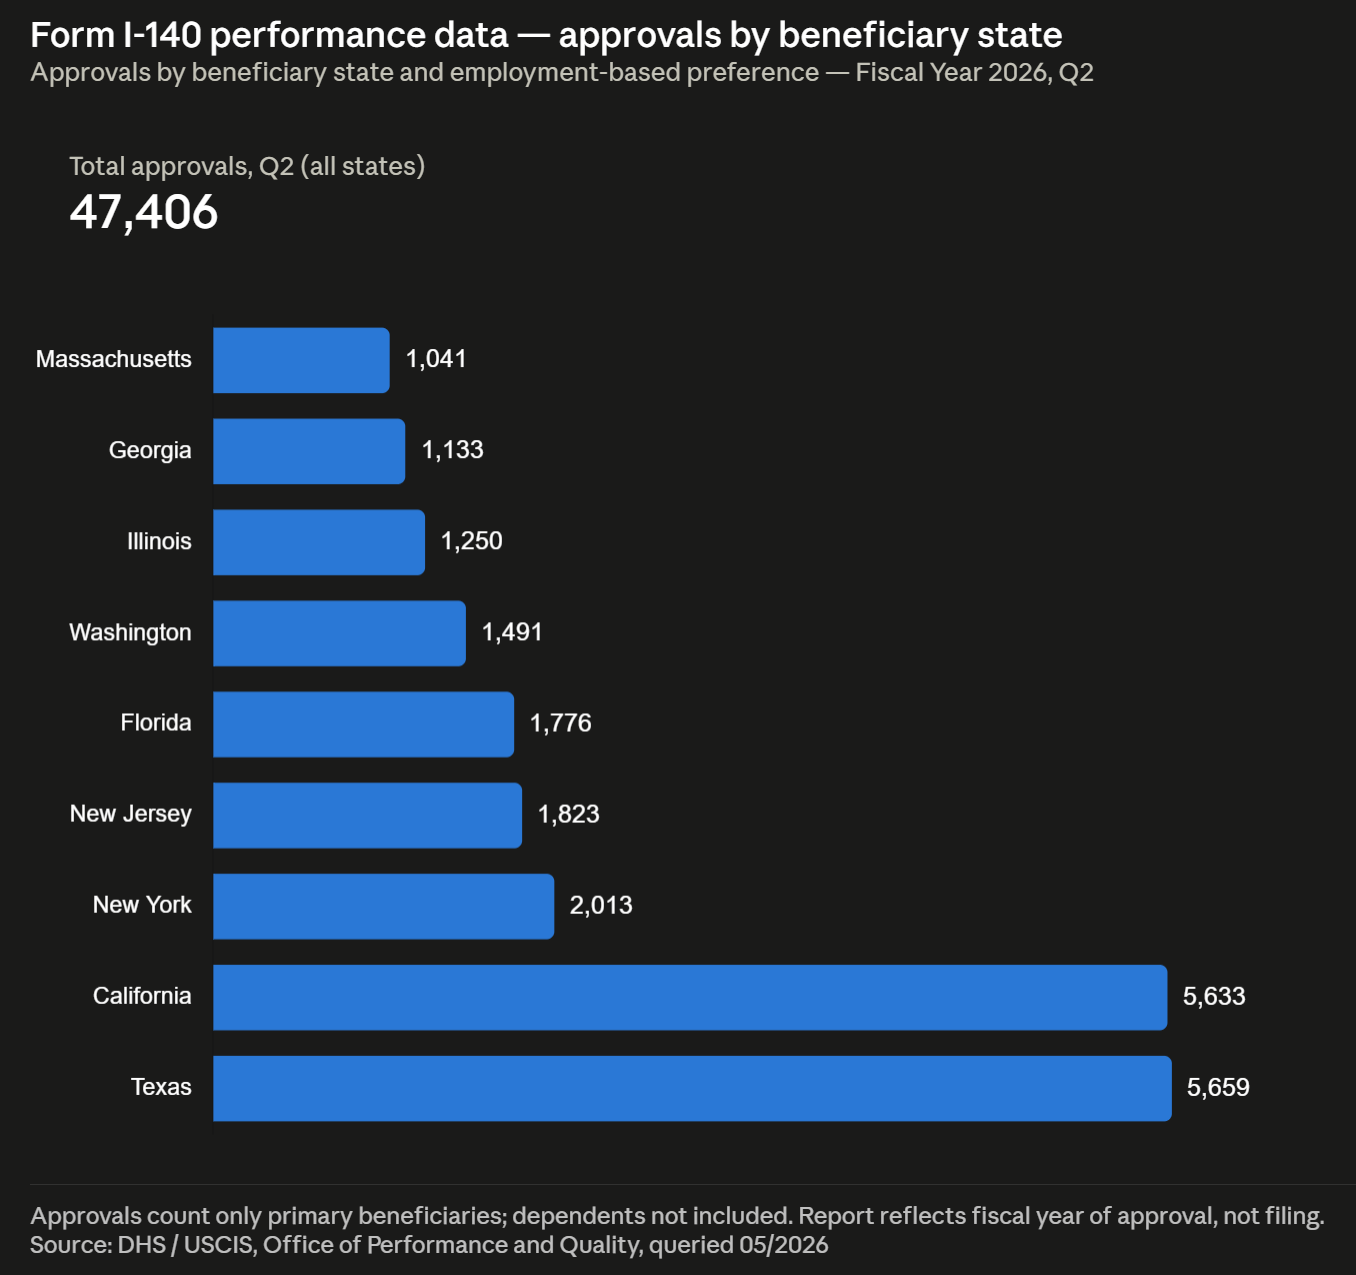
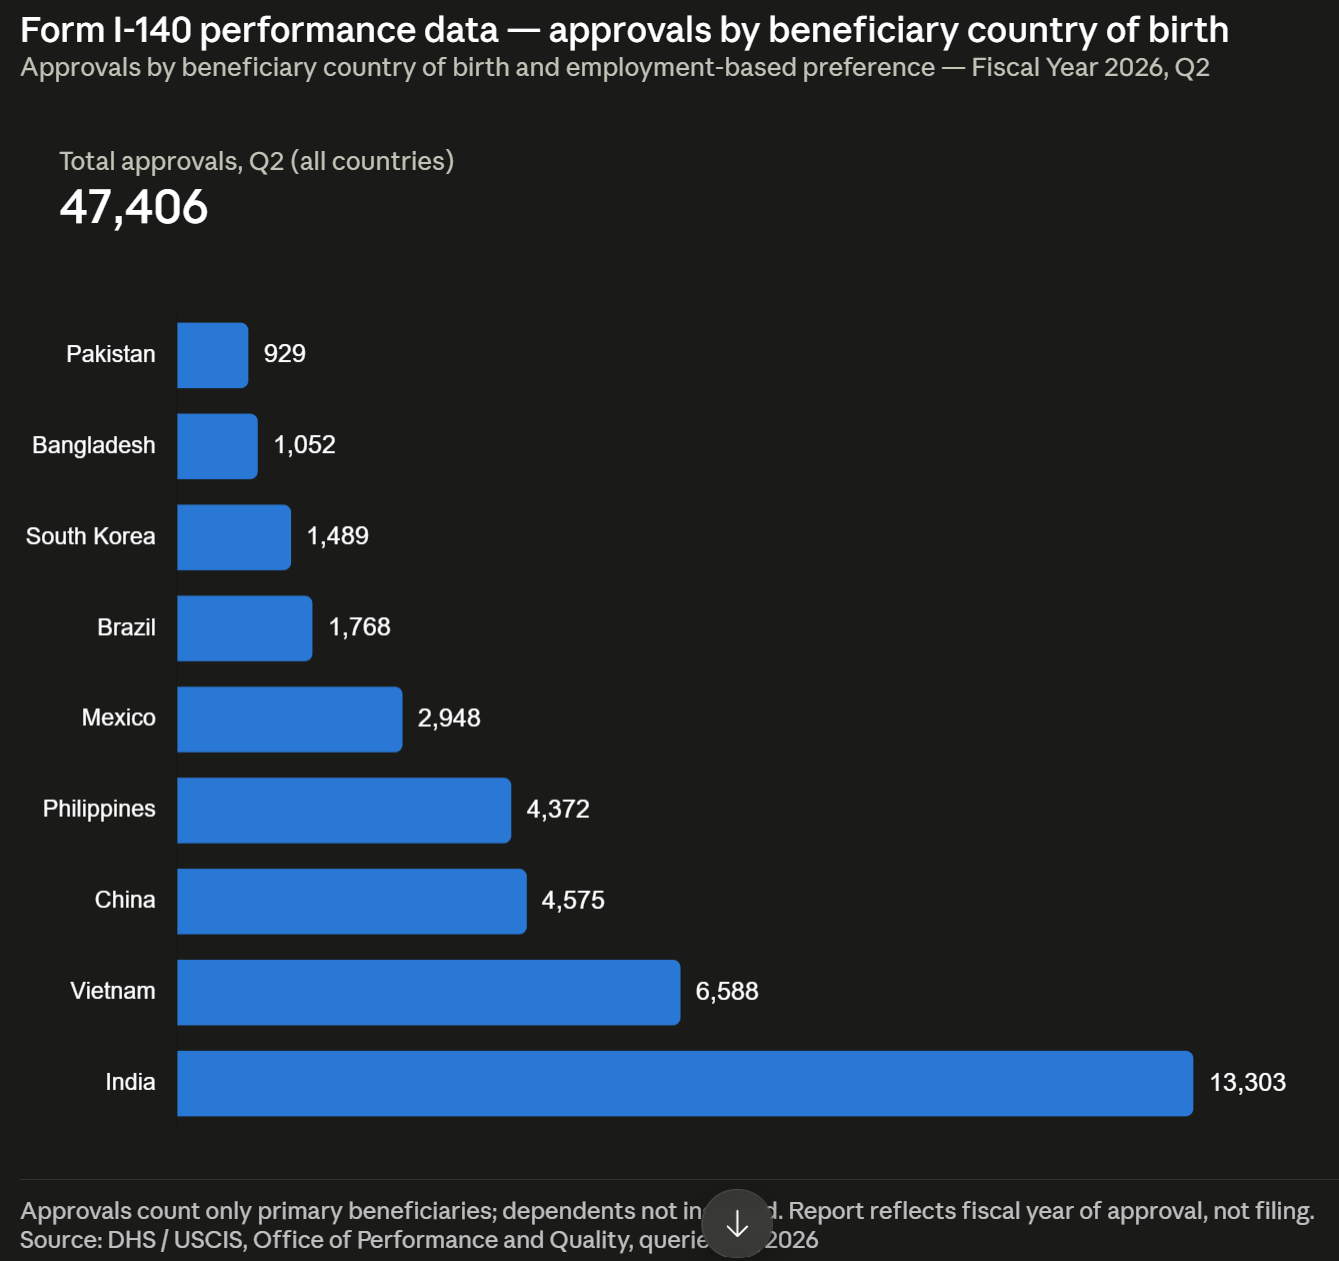
USCIS has released its official I-140 approval data for the second quarter of Fiscal Year 2026, covering October through December 2025, and the numbers reveal both the scale and the concentration of employment-based immigrant petition activity in the United States. Across all preference categories, USCIS approved 47,406 I-140 immigrant petitions during this single quarter, with India accounting for 13,303 of those approvals — more than 28 percent of the global total. For employers, foreign nationals, and HR professionals tracking I-140 approval trends, these figures offer a meaningful window into where demand is concentrated, which visa categories are driving volume, and what the data means for long-term green card planning.
Background
The Form I-140, Immigrant Petition for Alien Worker, is the foundational document in most employment-based green card processes. An approved I-140 does not itself grant permanent residence — it establishes that a foreign national worker is eligible for a specific employment-based preference category and that a qualifying employer or, in certain cases, the worker themselves, has successfully demonstrated that eligibility to USCIS. After approval, the beneficiary must wait for a visa number to become available based on their preference category and country of birth before they can apply for adjustment of status or an immigrant visa. USCIS releases quarterly I-140 approval data broken down by country of birth and preference subcategory, providing a rare statistical snapshot of where petitions are being approved across the employment-based immigration system.
What the Data Shows
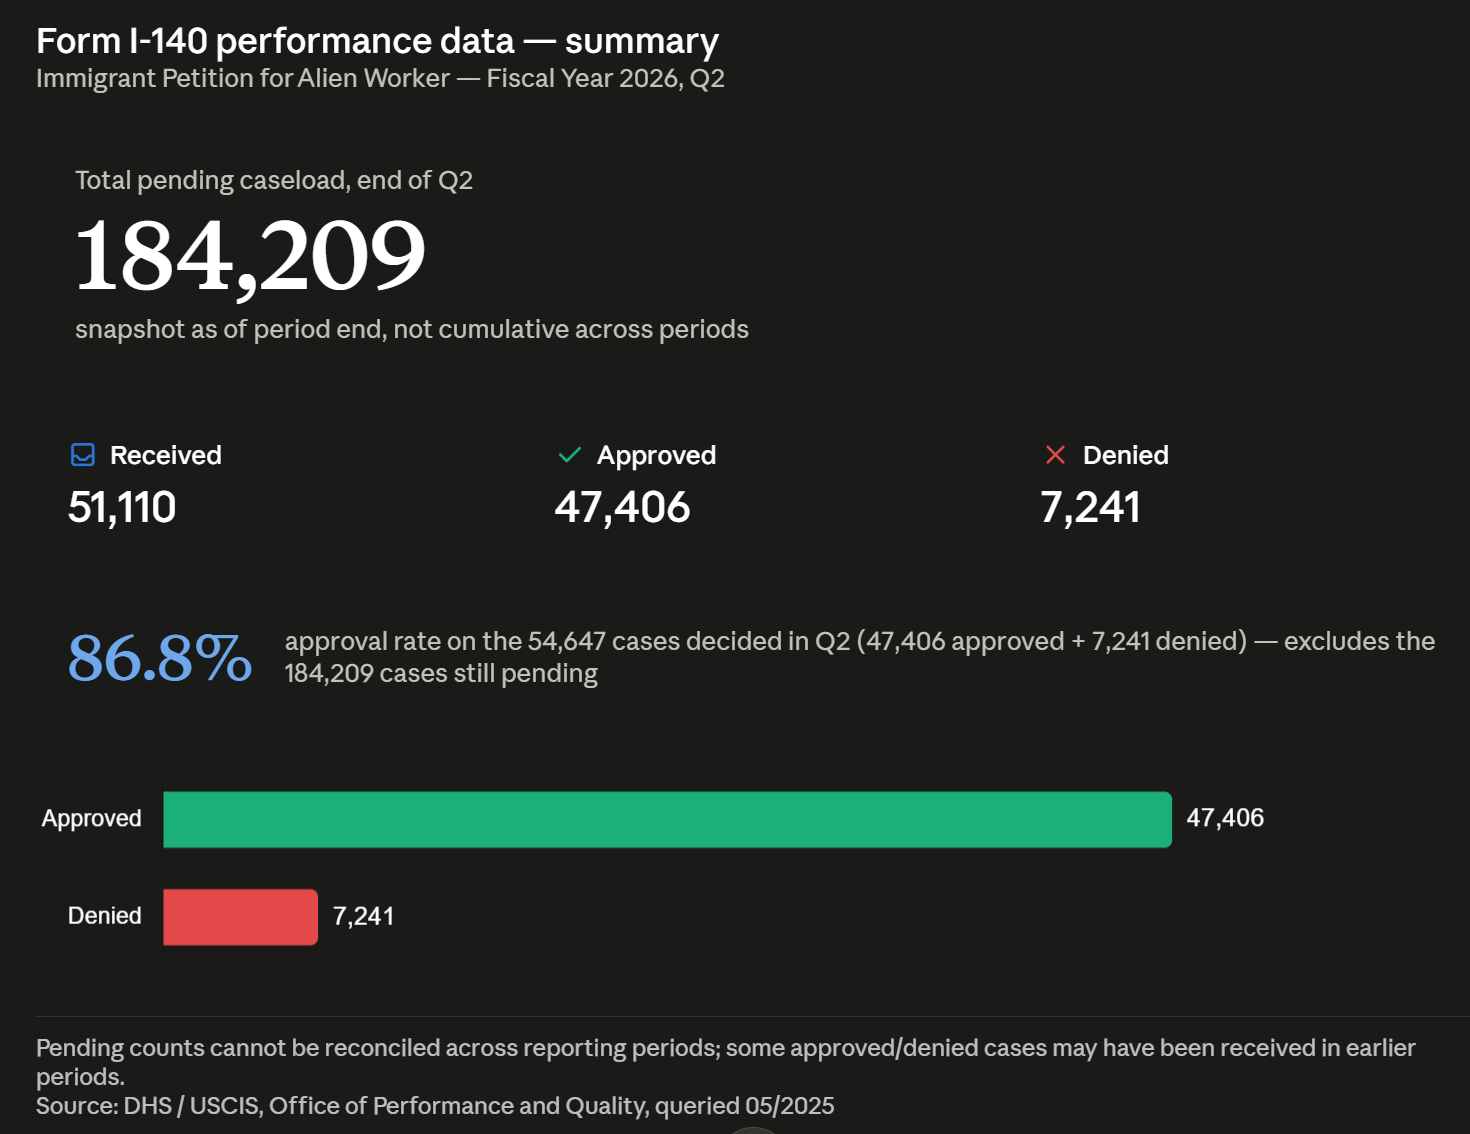
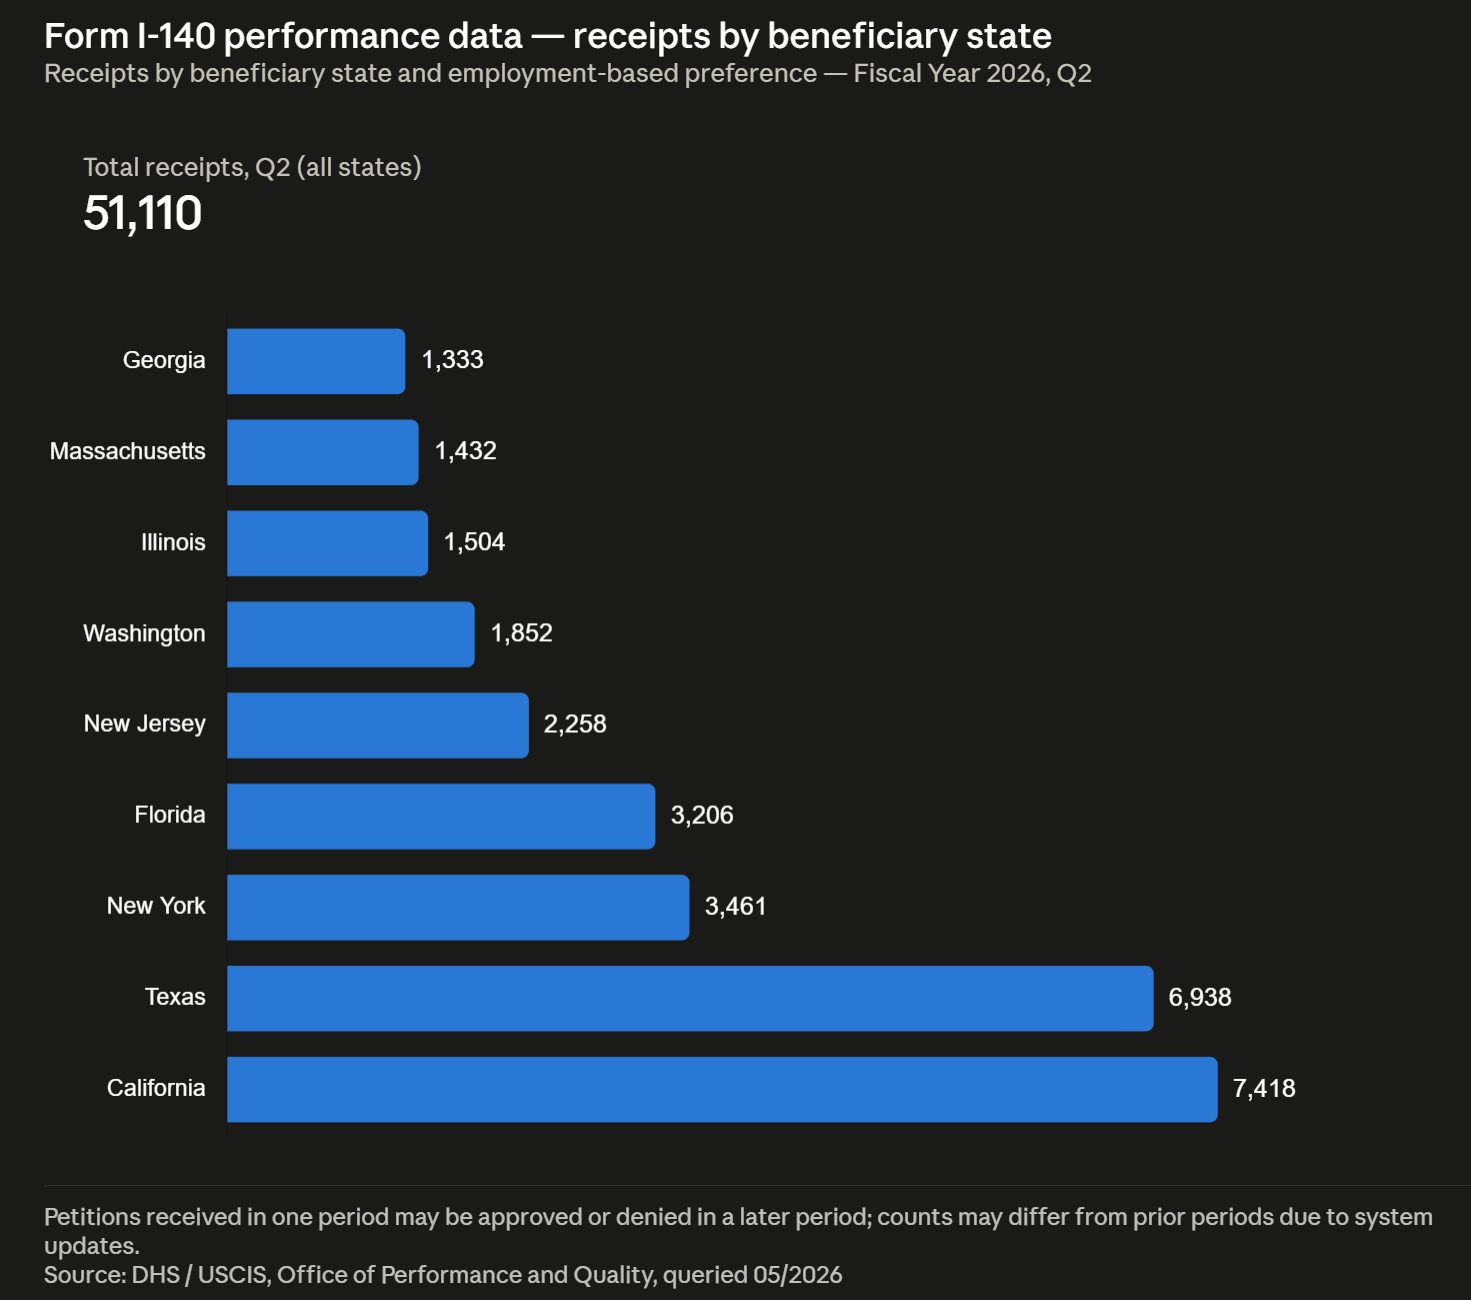
During FY2026 Q2, USCIS approved I-140 petitions across three primary preference tiers: EB-1, which covers extraordinary ability individuals, outstanding professors and researchers, and multinational executives or managers; EB-2, which covers professionals with advanced degrees and National Interest Waiver (NIW) applicants; and EB-3, which covers skilled workers, professionals with baccalaureate degrees, and unskilled workers. The grand total of 47,406 approvals spans all eight subcategories within these three tiers.
India’s dominance was most pronounced in the EB-2 advanced degree category, where 7,772 of the 10,958 global approvals — roughly 71 percent — went to Indian-born beneficiaries. India also produced 2,384 of the 5,947 EB-3 professional approvals. By contrast, India’s NIW numbers were relatively modest at 440, compared to China’s 860, suggesting meaningfully different petition strategies between the two largest sending countries.
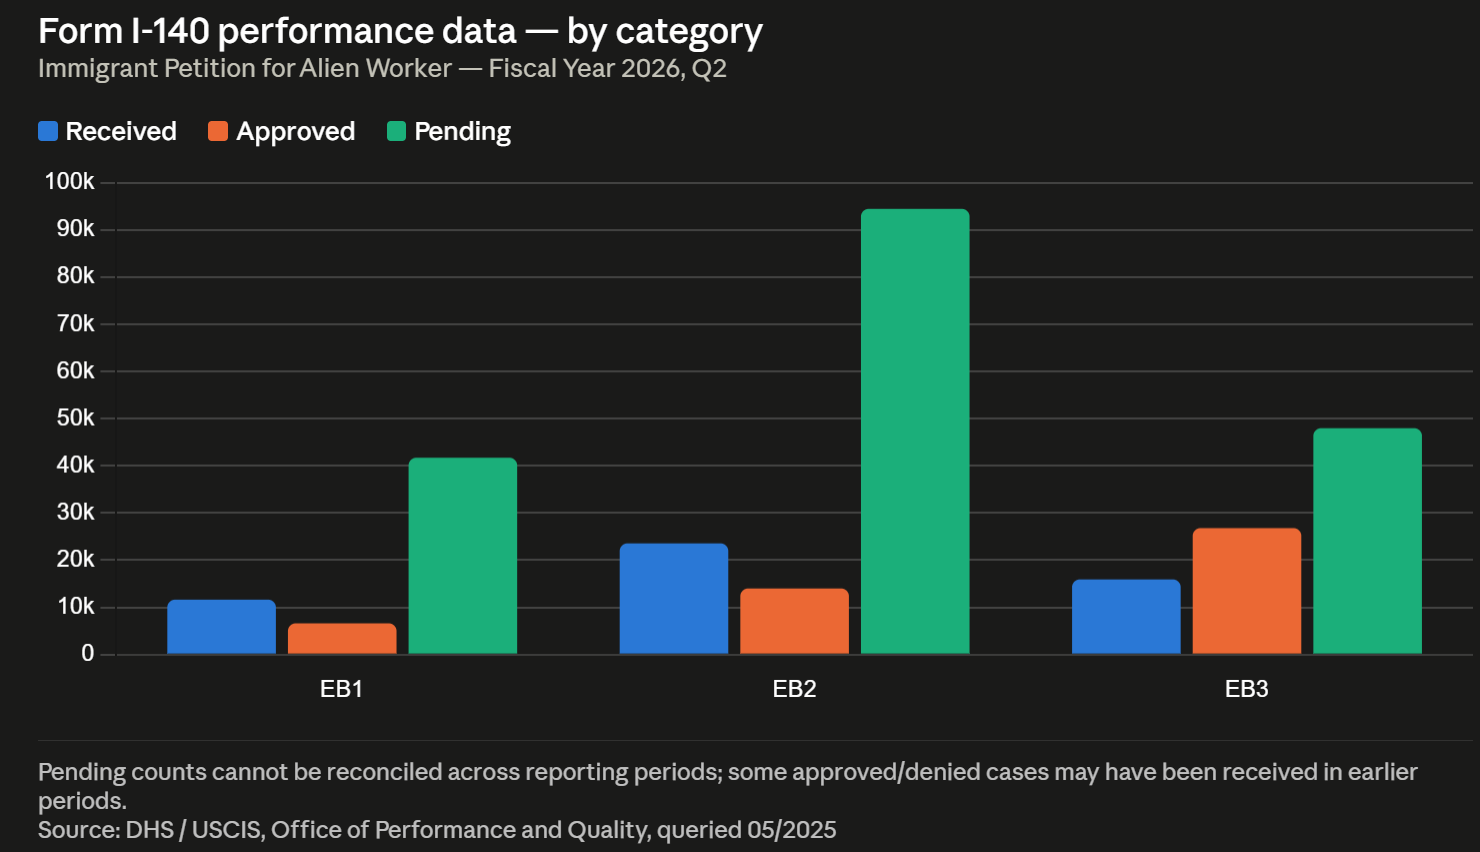
Vietnam ranked second overall with 6,588 approvals, but that figure was almost entirely driven by the unskilled worker category, where 6,368 Vietnamese-born beneficiaries received approvals out of a global total of 14,871 in that subcategory. The Philippines followed at 4,372 approvals, with the bulk of its volume concentrated in EB-3 skilled worker approvals — 2,399 out of 5,981 globally — consistent with longstanding patterns in the healthcare and skilled trades sectors. China came in at 4,575 approvals, with a notably diversified distribution across EB-1 extraordinary ability, EB-2 advanced degrees, and NIW categories, reflecting its strong representation in research and academic communities.
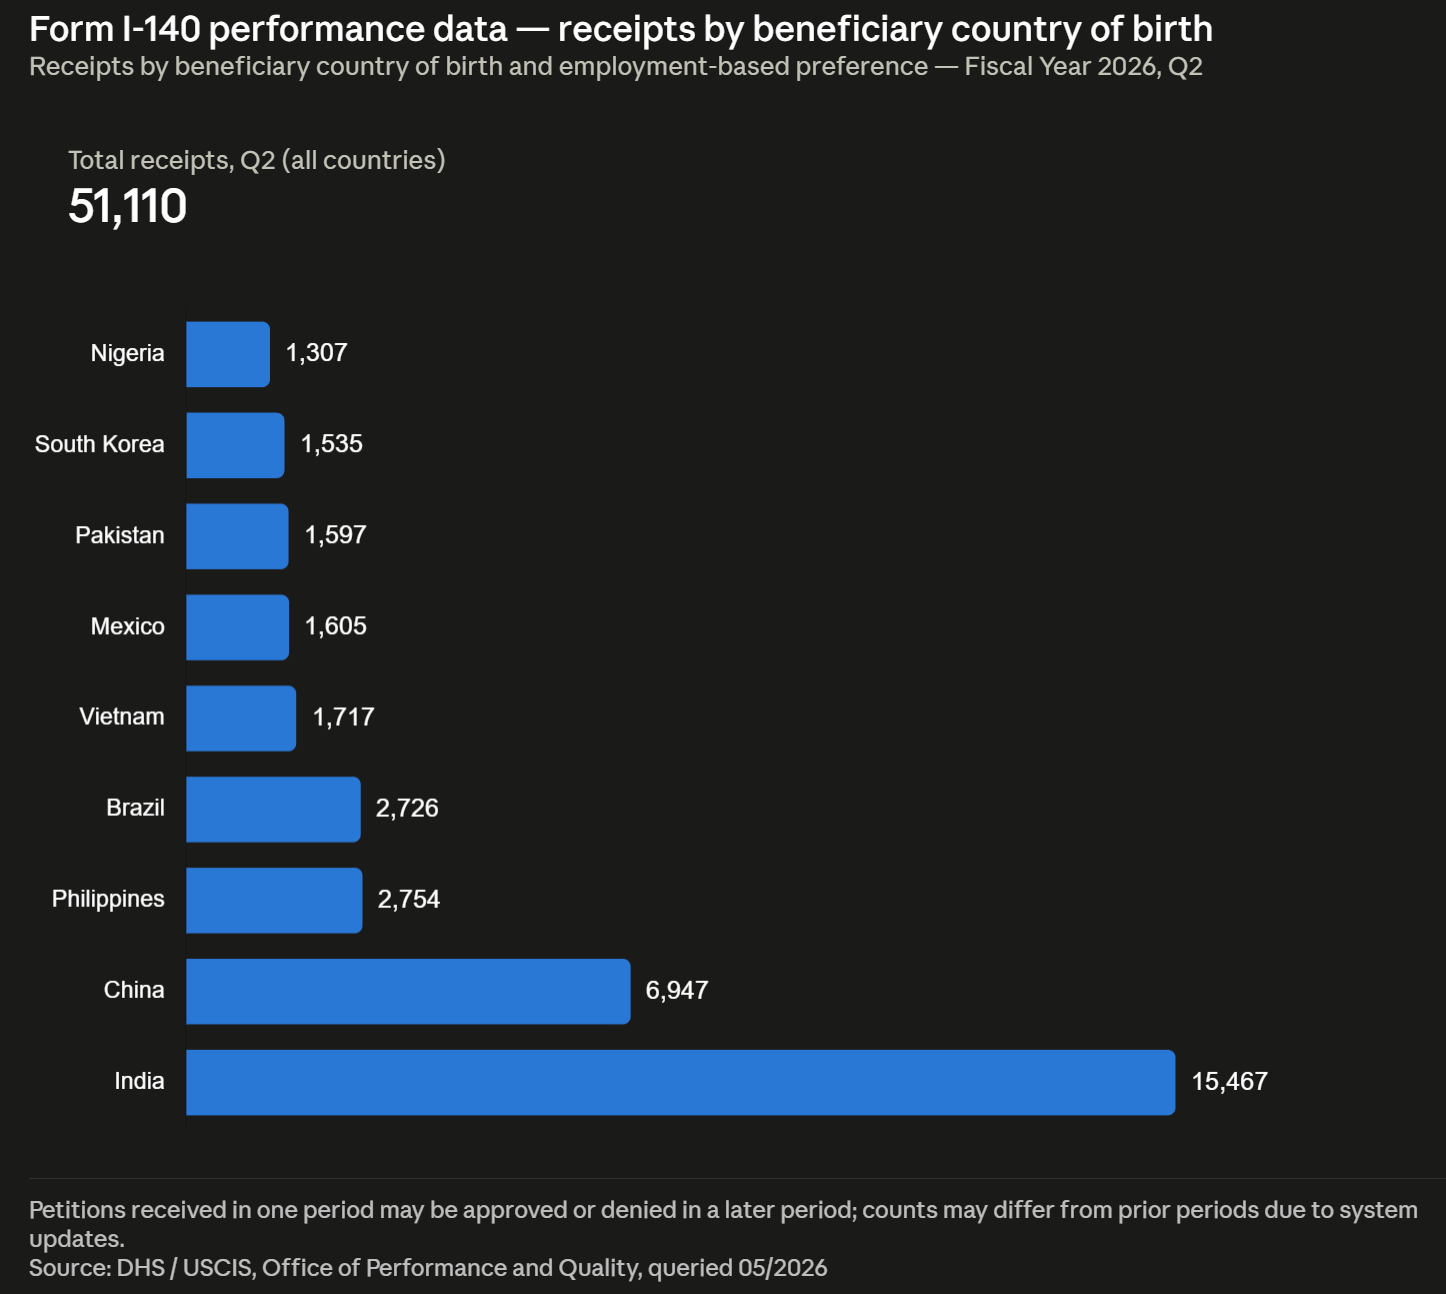
Mexico, Brazil, South Korea, Bangladesh, Pakistan, and Nepal each surpassed 750 approvals for the quarter. Countries from Europe, the Middle East, Africa, and the rest of Asia appear throughout the data, though most individual country totals remain well below 500.
Who Is Affected
Foreign nationals born in India with pending or planned employment-based green card cases are the most directly affected population in this data. While a high volume of I-140 approvals signals robust petition activity, Indian-born EB-2 and EB-3 applicants face some of the longest wait times in the system due to per-country annual limits on visa numbers — a statutory constraint that applies regardless of how many petitions are approved in any given quarter. The approval data here reflects adjudications only; it does not determine when a visa number will become available.
Employers sponsoring foreign national workers — particularly in technology, healthcare, engineering, research, and hospitality — are indirectly affected by these trends because they shape the strategic decisions companies must make about when to file, which preference category to pursue, and how to structure retention planning for long-term employees awaiting green cards. HR professionals and in-house immigration teams at companies with significant India-born or China-born workforces should take note of the category-specific breakdowns, since the path and timeline vary considerably between EB-1, EB-2, and EB-3 subcategories.
The data applies only to primary beneficiaries — dependents are not counted in these figures, per USCIS’s own notation. Additionally, because these counts are organized by the fiscal year in which the petition was approved rather than the year it was filed, some of these approvals reflect petitions that were submitted in earlier periods.
Practical Implications
For Indian-born workers concentrated in EB-2 advanced degree categories, the sheer volume of approvals in this single quarter reinforces why priority date management is so central to long-term green card strategy. An approved I-140 can be thought of as locking in a position in a queue rather than completing the journey. For many Indian-born EB-2 and EB-3 applicants, that queue is measured in years or, in some cases, decades — a reality that makes the timing of an I-140 filing, and the preservation of an early priority date, critically important.
NIW petitions represent a different strategic profile. With 440 Indian-born approvals and 860 Chinese-born approvals in this category, NIW continues to attract applicants who can self-petition without an employer’s sponsorship — a significant advantage for researchers, scientists, entrepreneurs, and other professionals who either cannot secure employer sponsorship or prefer to retain more control over their immigration timeline. The relatively lower India NIW number compared to EB-2 advanced degree approvals may reflect the strength of employer-sponsored pipelines for Indian nationals in the technology sector, rather than ineligibility for NIW.
For Filipino-born professionals — particularly nurses, physical therapists, and other healthcare workers — the high EB-3 skilled worker approval volume signals continued employer demand in those fields. However, like Indian-born workers, Filipino nationals also contend with per-country limits that extend wait times even after I-140 approval.
Companies tracking workforce planning should recognize that an I-140 approval, while a milestone, does not guarantee near-term work authorization changes. For employees in oversubscribed countries and categories, maintaining valid nonimmigrant status while a green card application remains pending is an ongoing compliance consideration that deserves regular review.
What to Watch For Next
USCIS will release subsequent quarterly data that will allow practitioners and applicants to track approval volumes over time and identify any significant shifts in category distribution or country-level trends. The State Department’s monthly Visa Bulletin, which governs when approved I-140 beneficiaries can move forward with their final green card applications, remains the primary instrument for tracking actual advancement in the queue. Stakeholders with approved I-140 petitions should monitor both the Visa Bulletin’s Final Action Dates and Dates for Filing charts, as the two charts govern different procedural opportunities depending on what USCIS announces each month. Further guidance on any legislative or regulatory changes affecting per-country limits would have significant implications for the populations most represented in this dataset.
How Immigration Professional Association Can Help
The numbers in this dataset are meaningful only if you understand where your own case fits within them — and that requires more than reading a table. At Immigration Professional Association, we work directly with foreign national professionals, their employers, and HR teams to navigate every stage of the employment-based green card process, from evaluating which I-140 preference category best fits a worker’s background to managing priority date strategy across EB-1, EB-2, and EB-3 pathways.
For Indian-born and Chinese-born professionals who are already in the pipeline or considering initiating a case, we understand the long-arc planning that these categories require: protecting an early priority date, evaluating concurrent filing eligibility, assessing NIW as an alternative or complementary strategy, and maintaining valid status through what can be an extended wait. For employers with multinationals or outstanding researcher talent, we handle EB-1 petitions that can offer meaningfully different timelines than employer-sponsored EB-2 or EB-3 filings.
If this data raises questions about your own situation — whether you’re an individual professional trying to understand your options or an HR manager trying to make sense of your company’s immigration exposure — Immigration Professional Association is ready to help you work through the specifics. Reach out to our team to discuss what FY2026 Q2’s I-140 approval data means for your employment-based immigration path.